
A dashboard full of green charts may still leave a team unable to answer a customer's question: where did my request go? Start instrumentation with one journey, such as an export that crosses the web app, API, queue and worker. The goal is to find the stage that failed and the record needed to recover it.
Connect the stages
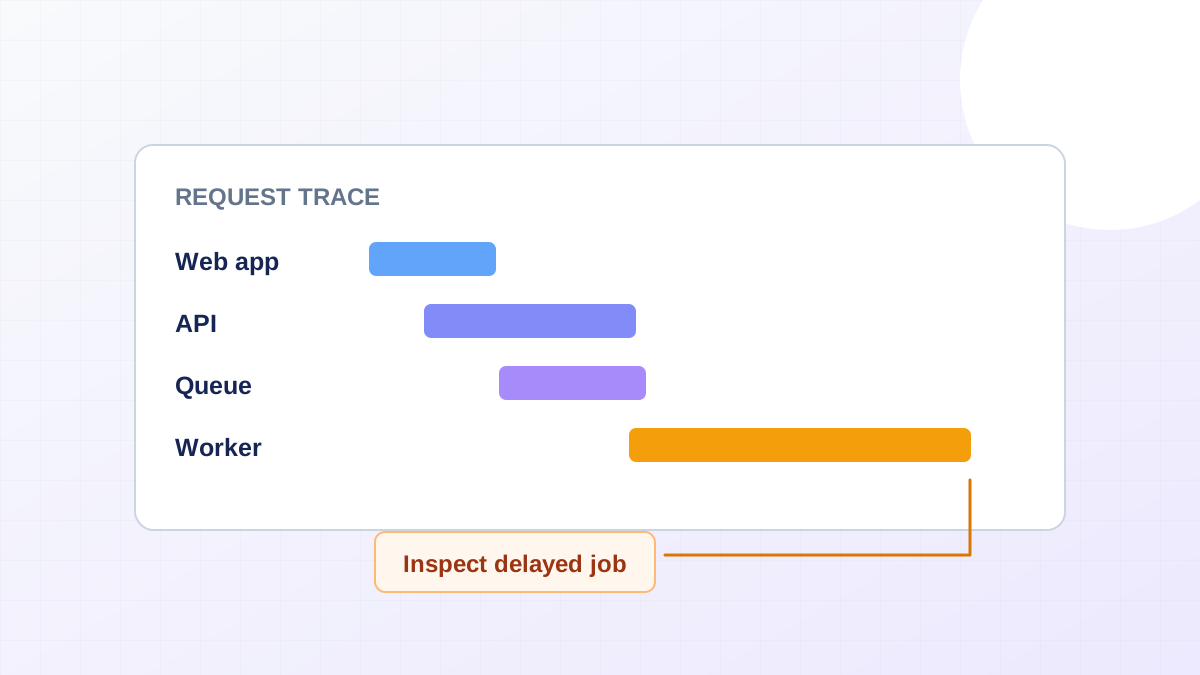
Carry a correlation identifier through the request and its background work. Capture when each stage starts, finishes or fails, and distinguish queue wait time from processing time. Use stable operation names so measurements remain comparable across releases. Avoid putting raw personal information into identifiers or span attributes.
The OpenTelemetry signals guide describes traces, metrics and logs as different forms of telemetry. Use traces to inspect a request's path, metrics to see patterns across requests and logs for selected diagnostic details. They become more useful when an operator can move between them using shared context.
Alert on a condition someone can act on
For an export workflow, a growing queue of old jobs may matter more than a brief CPU spike. Define what an operator should inspect when the alert fires and which intervention is safe. Include the relevant dashboard and runbook in the alert, plus an owner for the workflow. An alert without an expected response is likely to become background noise.
Keep error categories narrow enough to guide action. A missing input record, a provider timeout and a rejected permission check need different responses. Record a release identifier so a team can see whether a change introduced the failure, but do not assume every incident began with the latest deployment.
Prove the recovery path
Run a controlled test in a non-production environment: pause a worker, submit a request and check that the delayed work is discoverable. Resume processing and verify the final state. Then remove a required dependency and check whether the resulting error points to the real cause. This exercise exposes gaps that a healthy dashboard cannot show.
Bring a representative failed request to a technical audit. For integrations, pair the trace with the event history from our webhook retry guide, so diagnosis leads to a safe replay rather than a blind resubmission.